2020 Work Orders
2020 Year End Review of Work Order Numbers
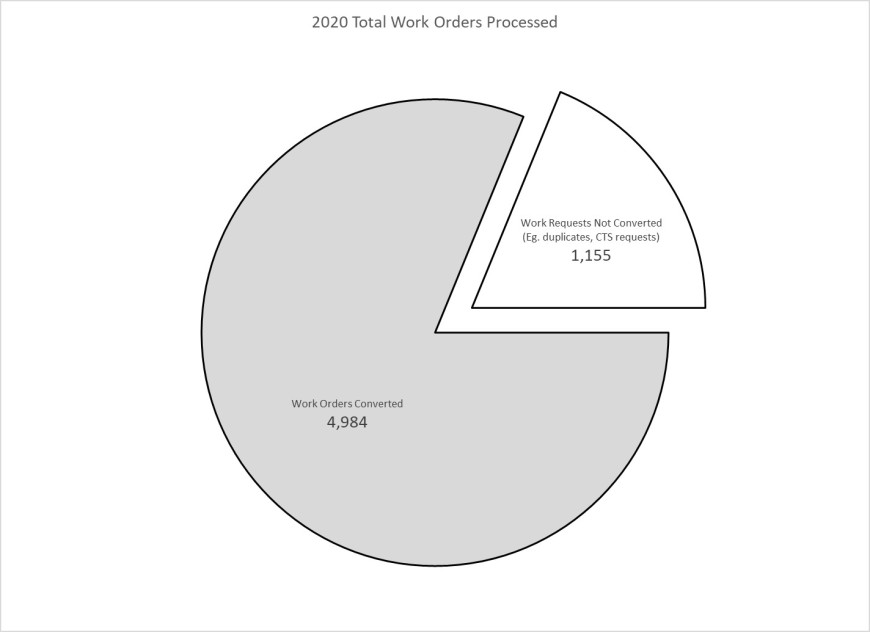
In 2020, Facilities Management received 6139 work requests, roughly half of the 12,567 work requests made in 2019. Of these, 1155 (19%) were not converted in to work orders, either because they were duplicates of existing work orders, belonged to a different department (Eg. Campus Technology Services), or because they were not actionable.
For all work orders closed in the system, customers are sent a satisfaction survey that asks users to rank staff professionalism, repair time, and satisfaction with the repair on a 5-point scale ranging from “Very Dissatisfied” to “Very Satisfied”. For those surveys that are filled out with a “Dissatisfied” or “Very Dissatisfied” answer, outreach is performed to the user to clarify their submission response and corrective action is taken (Eg. opening the work order for additional work, discussing with staff). As the survey results are permanent once entered, users are unable to provide an updated satisfaction rating after follow-up work or in the event a satisfaction is entered incorrectly.
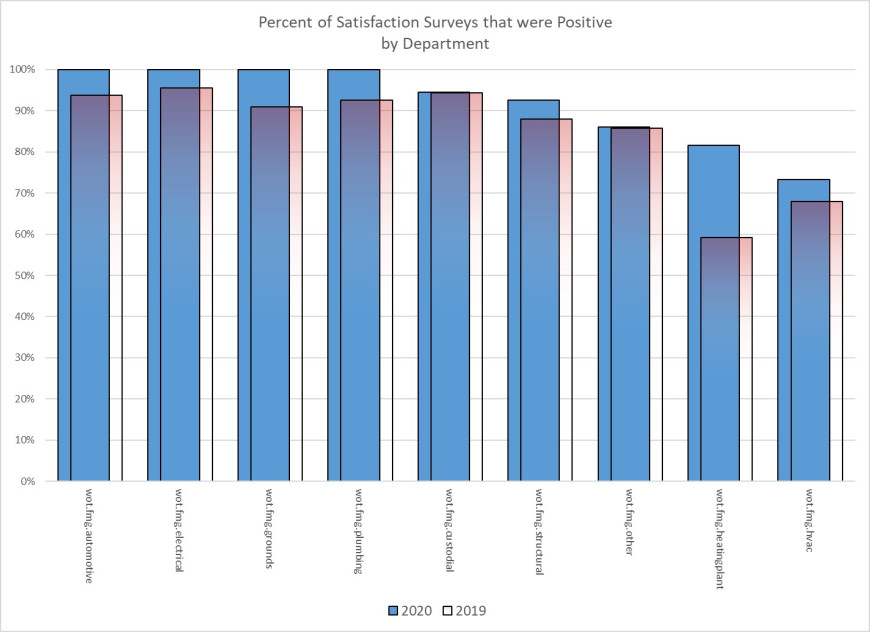
Overall, 368 surveys were submitted of which 337 (92%) reported a positive satisfaction. The Structural department received the greatest number of surveys at roughly half of the total submitted, however, they ranked sixth for overall satisfaction. Almost every department had an increased rate of positive survey results, less the Custodial department and Administration who remained roughly equivalent to the previous year. Of note, the Heating Plant’s survey satisfaction rate increased by over 20% while maintaining proportionately the same number of surveys from the previous year.
The following are the departments and their satisfaction rates for 2020:
- Automotive - 100% (up from 94%)
- Electrical - 100% (up from 96%)
- Grounds - 100% (up from 91%)
- Plumbing - 100% (up from 93%)
- Custodial - 94% (equal to previous year)
- Structural - 93% (up from 88%)
- Administration/Other - 86% (equal to previous year)
- Heating Plant - 82% (up from 59%)
- HVAC - 73% (up from 68%)
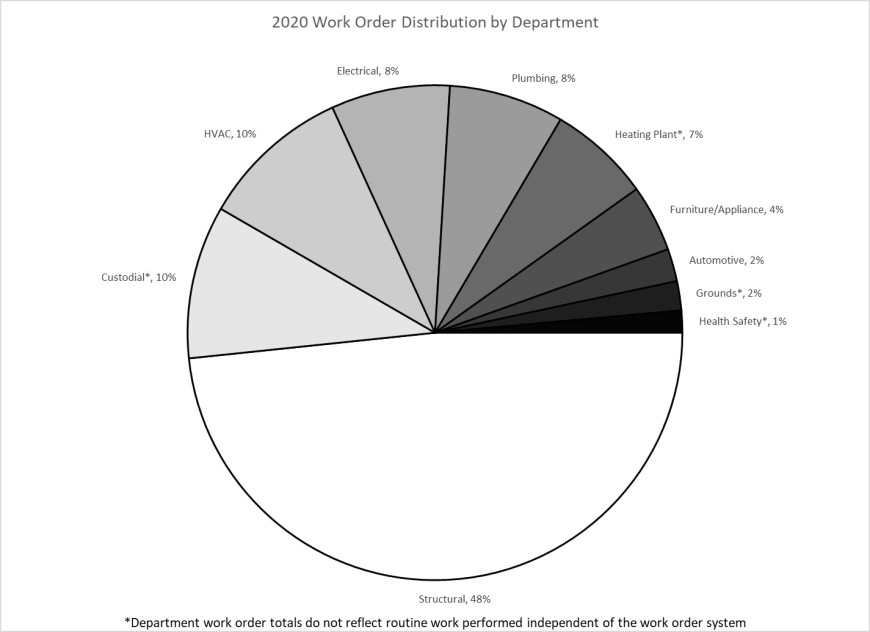
The Structural department accounted for roughly half (48%) of all work orders assigned. Please note that these distributions may not reflect those departments who perform routine work independent of the work order system, these being Custodial, Heating Plant, Grounds, and Health Safety.
The following are the departments and their percentage of FMG work orders:
- Structural - 48%
- Custodial - 10%
- HVAC - 10%
- Electrical - 8%
- Plumbing - 8%
- Heating Plant - 7%
- Furniture and Appliances - 4%
- Automotive - 2%
- Grounds - 2%
- Health Safety - 1%
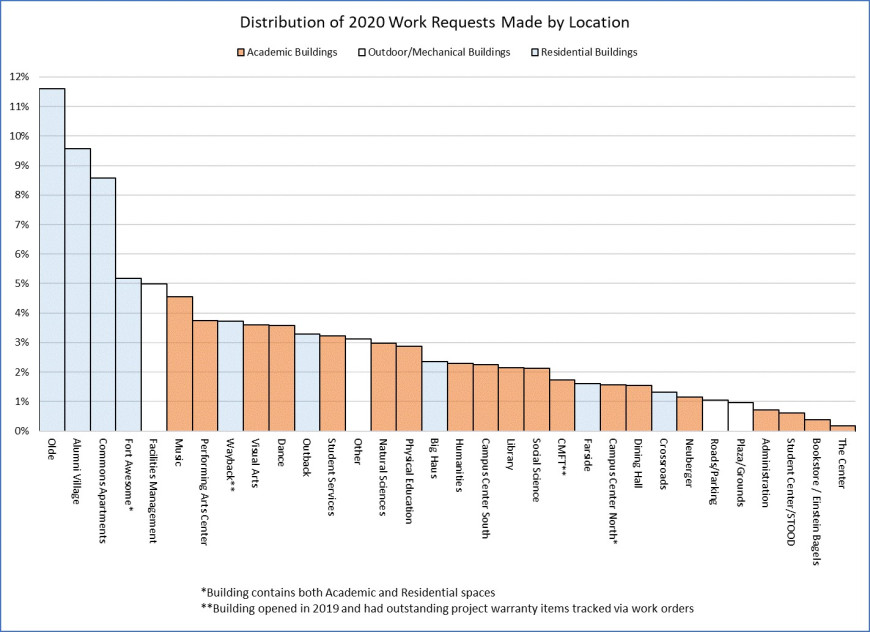
When accounting for work order location, the majority were completed within residential buildings (50%), followed by academic (40%) and lastly outdoor/mechanical spaces (10%).
Of those work orders completed across the ten residential buildings/areas, the three apartment buildings (Olde, Alumni Village, and Commons) comprised over half of all residential work orders. Similarly, the three apartment buildings comprised roughly half of all bed spaces within residential buildings during this period, so the higher volume of work requests is not necessarily indicative of a greater number of issues within the buildings themselves.
The following are the buildings (groupings) and their percentage of FMG work requests:
- Olde Apartments (Residential) - 12%
- Alumni Village (Residential) - 10%
- Commons Apartments (Residential) - 9%
-
Fort Awesome (Residential) - 5%
- Building contains both Academic and Residential spaces
- Facilities Management (Outdoor/Mechanical) - 5%
- Music (Academic) - 5%
- Performing Arts Center (Academic) - 4%
-
Wayback (Residential) - 4%
- Building opened in 2019 and had outstanding project warranty items tracked via work orders
- Visual Arts (Academic) - 4%
- Dance (Academic) - 4%
- Outback (Residential) - 3%
- Student Services (Academic) - 3%
- Other (Outdoor/Mechanical) - 3%
- Natural Sciences (Academic) - 3%
- Physical Education (Academic) - 3%
- Big Haus (Residential) - 2%
- Humanities (Academic) - 2%
- Campus Center South (Academic) - 2%
- Library (Academic) - 2%
- Social Sciences (Academic) - 2%
-
Center for Media, Film, and Theatre (Academic) - 2%
- Building opened in 2019 and had outstanding project warranty items tracked via work orders
- Farside (Residential) - 2%
-
Campus Center North (Academic) - 2%
- Building contains both Academic and Residential spaces
- Dining Hall (Academic) - 2%
- Crossroads (Residential) - 1%
- Neuberger Museum (Academic) - 1%
- Roads/Parking Lots (Outdoor/Mechanical) - 1%
- Plaza/Grounds (Outdoor/Mechanical) - 1%
- Administration (Academic) - 1%
- Student Center/STOOD (Academic) - 1%
- Bookstore (Academic) - <1%
- The Center for Engagement (Academic) - <1%